In the competitive world of Software-as-a-Service, data is far more than a collection of number. It is the lens through which a SaaS business understands its financial health, customer behavior, marketing effectiveness, and long-term sustainability. The right KPIs provide clarity, highlight hidden opportunities, and help teams move beyond intuition toward predictable growth.
This article explores the most important SaaS KPIs across three major pillars: revenue growth, customer retention, and acquisition & product engagement. Each metric is explained in detail, with practical insights on how to interpret it and what it reveals about your business.
In addition to understanding how these KPIs are calculated and why they are important, we will also see how to visualize them in a simple and clear way thanks to the Gyule software.
To create a Gyule account, you can sign up here: www.gyule.io
We’ll divide the KPIs into three groups and create three different dashboards for each to ensure the data is immediately visible and clear.
1. Revenue Growth Metrics
Revenue metrics sit at the core of every SaaS operation. Because SaaS relies on recurring subscriptions, these KPIs reflect both stability and momentum.
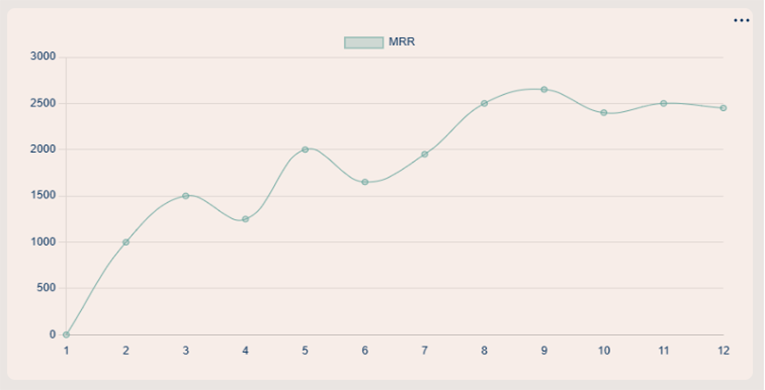
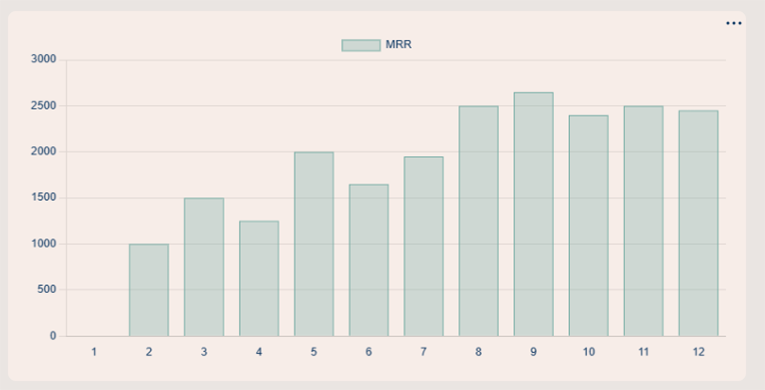
Monthly Recurring Revenue (MRR)
MRR represents the predictable revenue generated each month from subscriptions. It is the backbone of SaaS analytics because it eliminates fluctuations caused by one-time payments and aligns revenue with time.
How to calculate MRR:
If your SaaS has only a monthly subscription fee, it is simple to calculate:
MRR = sum of payments in a specific month
If your SaaS has annual subscription plans, you need to calculate:
MRR = (number of paying customers in a specific month) × (average annual price ÷ 12)
For example, if you have 10 customers who paid an average price of $1,200 for the whole year:
MRR = 10 × ($1,200 ÷ 12) = $1,000
Why it matters:
- Allows segmentation into more detailed MRR components
- Enables accurate forecasting
- Highlights the long-term impact of churn and acquisition
How to visualize MRR? To visualize MRR you can use a line chart or a bar chart.
Annual Recurring Revenue (ARR)
ARR simply aggregates MRR into a 12-month metric. Many organizations use ARR for strategic planning, fundraising discussions, and long-term goal setting.
Like MRR you can visualize ARR with a line chart or a bar chart.
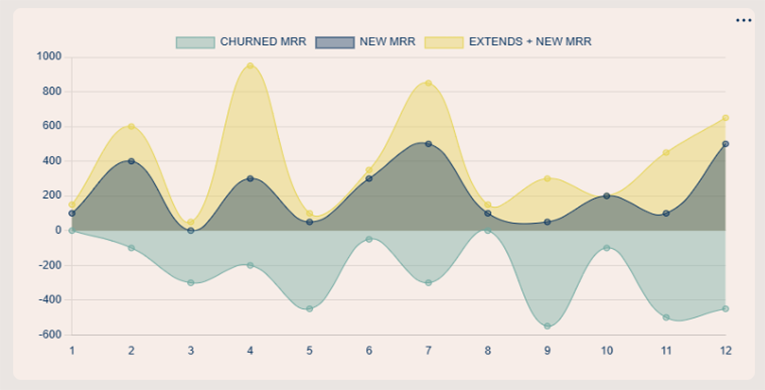
New MRR
This measures the recurring revenue added during a specific period from new customers only.
To better analyze New MRR, it is important to cross-reference the data with Exapnsion MRR and the churn rate (we’ll see this later). To visualize this information, we can use a stacked area chart.
A consistent rise in New MRR indicates:
- Effective marketing
- Strong product-market fit
- Healthy sales pipeline performance
Expansion MRR
Expansion MRR reflects revenue gained through upsells, cross-sells, or upgrades. It is one of the most powerful growth levers in SaaS because it increases revenue without requiring new customer acquisition.
Common examples include:
- Moving to a higher subscription tier
- Paying for add-on features
- Paying for increased usage
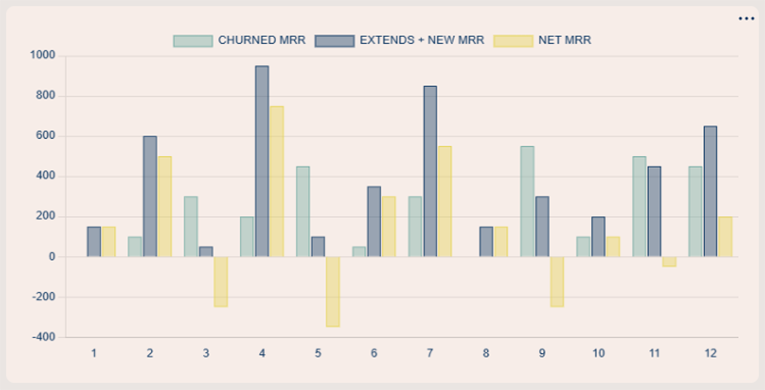
Churned MRR
This measures the recurring revenue lost due to customer cancellations or downgrades. Even small changes in churn can drastically impact long-term revenue, making it one of the most monitored KPIs.
As mentioned before, it is very important to compare Churn Rate with Expansion MRR and with New MRR. By doing this, you can calculate net MRR growth.
Another metric we will look at is the Customer Churn Rate, which differs from Churn MRR because it measures the rate of customers lost and does not take revenue into account.
Net MRR Growth
The single greatest indicator of revenue health is:
Net MRR = New MRR + Expansion MRR – Churned MRR
Positive net growth means your business is expanding even after accounting for losses. Many SaaS companies target 5–10% net MRR growth per month in early stages.
2. Customer Retention & Lifetime Value
Retention metrics reveal how well the product delivers ongoing value. For subscription businesses, acquiring a customer is only the first ste, keeping them is where profitability is gained.
Average Revenue Per User
ARPU (Average Revenue Per User) measures the average revenue generated per user over a given period of time. It is calculated by dividing total revenue by the number of active users and helps evaluate the effectiveness of pricing and monetization strategies.
ARPU = Total Year Revenue/Total year Active Customer
Customer Lifetime Value (LTV)
LTV represents the total expected revenue a customer will generate before cancelling. It incorporates both pricing and churn, making it essential for understanding profitability.
A simplified calculation is:
LTV = Average Revenue Per User (ARPU) / Customer Churn Rate
A strong LTV means:
- Customers receive ongoing value
- Upsell potential is high
- Expansion MRR is sustainable
3. Acquisition, Activation, and Engagement
Beyond revenue and retention, SaaS companies must understand how users discover, interact with, and find value in their products.
Customer Acquisition Cost (CAC)
CAC aggregates all marketing and sales expenses and divides them by the number of new customers acquired. This metric guides budgeting and helps determine whether marketing channels are scalable.
Activation Rate
Activation tracks how many new users reach the first meaningful point of value inside the product. This “aha moment” varies by SaaS model:
- Email tools → sending the first campaign
- Analytics platforms → creating the first dashboard
- Project management software → completing the first task
Activation is one of the strongest predictors of long-term retention.
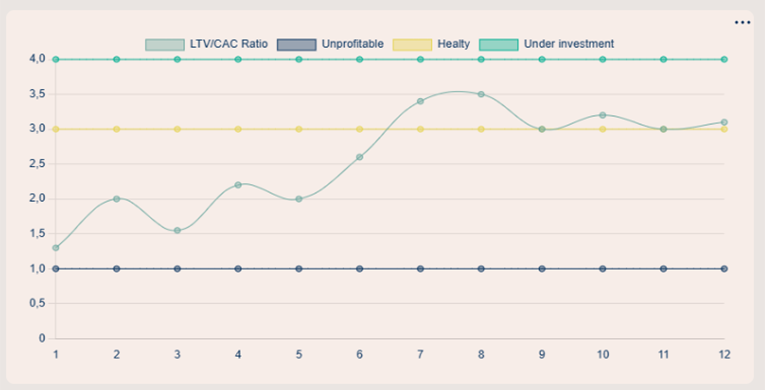
LTV/CAC Ratio
This ratio compares the value of a customer (LTV) with the cost to acquire them (CAC). It is one of the most widely used financial indicators in SaaS.
Typical guidelines:
- 3:1 is considered healthy
- Above 4:1 may indicate under-investment in growth
- Below 1:1 means acquisition is unprofitable
Conclusion
The KPIs outlined above form a powerful framework for understanding the performance and trajectory of any SaaS business. While revenue metrics provide a clear picture of profitability, retention and activation metrics reveal the deeper truth about product value and customer behavior. Together, they paint a holistic picture of growth, helping teams take strategic action with confidence.
Whether your goal is scaling, refining your product, improving marketing efficiency, or preparing for investment, mastering these KPIs ensures that every decision is grounded in meaningful data rather than guesswork.
Leave a Reply