
In this article, we will see how to insert a dashboard with charts in WordPress. The process is very simple. In this example, we show how to do it using Gutenberg, but we can do the same with other builders.
To do this, we use Gyule.io, a software that allows us to use different data sources and create beautiful dashboards with charts and tables.
To create a Gyule account, you can sign up here: www.gyule.io
Choose a data source
The first thing to do is choose where our data comes from. In our case, we have our data in a Google Sheets and we connect our Google Sheets to Gyule. By doing this, we can edit our data in Sheets and it will be automatically updated in our WordPress dashboards and charts.
Create the dashboard
Now it’s time to create the dashboard. In gyule we can create a dashboard with different rows and columns. We can select from three elements: Card, Chart or Table. For element chart we can select different types like line chart, bar chart, pie chart etc..
To better understand how to create a dashboard in Gyule you can see this article.
Share dashboard and charts
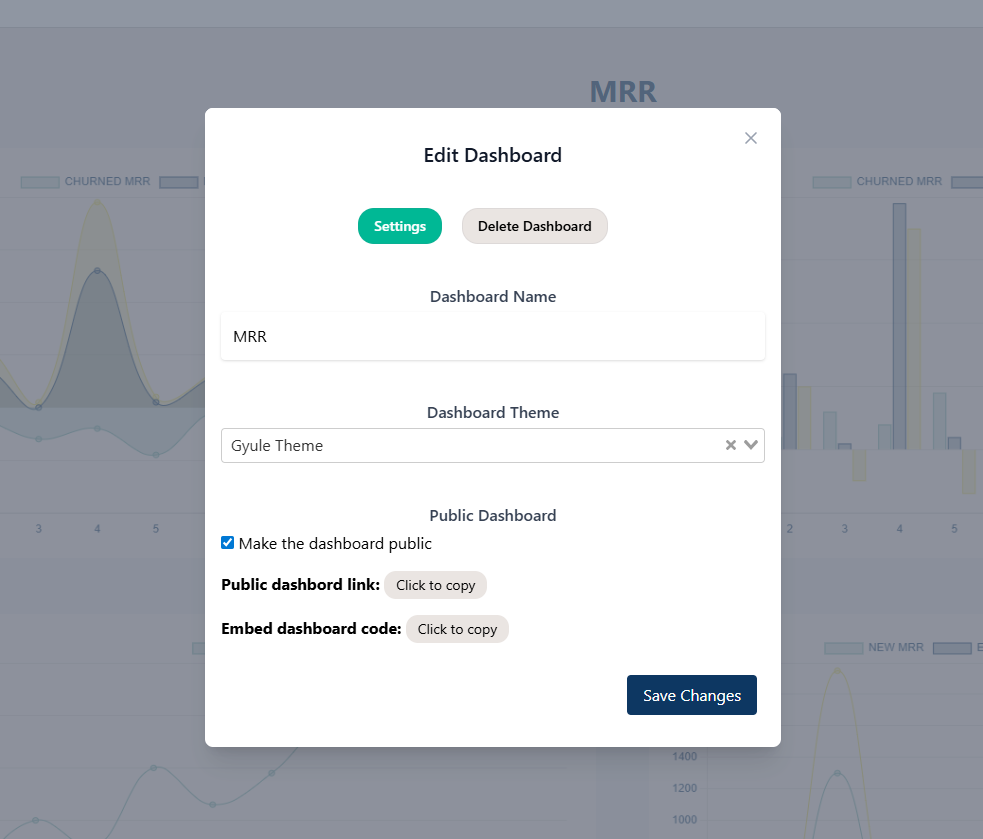
Sharing our dashboards and charts in WordPress is very simple. After creating a dashboard, we need to make it public.
Click the three dots in the top-right corner to edit the dashboard, and check “Make the dashboard public”.
After saving, reopen the edit dashboard popup and copy the public dashboard link.
Embed Dashboard and charts in our WordPress site
Now, open our WordPress site and choose where we want to insert the dashboard, for example in a post or a page.
Open the Gutenberg editor (but we can do the same thing with other editors) and select “Embed” element. Then we paste the link copied before.
Now the dashboard is visible. We must save and publish our page or post to make it visible to our visitors.
Here we can see an example page with a Gyule dashboard:
Leave a Reply