
Running an e-commerce business without tracking the right KPIs is like navigating without a map. Key Performance Indicators (KPIs) help you understand how your store is performing, where you are losing opportunities, and how to improve profitability.
Below are the 8 most important KPIs for anyone managing an e-commerce business, from small online shops to large marketplaces.
In addition to understanding how these KPIs are calculated and why they are important, we will also see how to visualize them in a simple and clear way thanks to the Gyule software.
To create a Gyule account, you can sign up here: www.gyule.io
1. Conversion Rate
The conversion rate measures the percentage of visitors who complete a purchase.
It is simple to calculate:
Formula:
Orders ÷ Visitors × 100
For example, if you have 1000 unique visitors and 12 orders the conversion rate is: 12 ÷ 1000 x 100 = 1,2%.
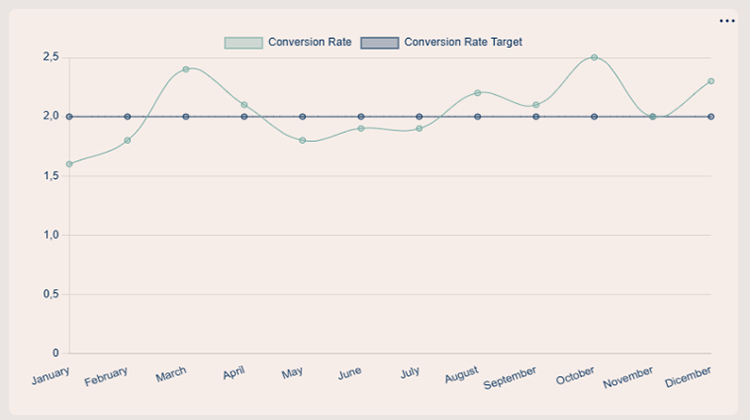
This KPI shows how effective your website is at turning traffic into customers. A low conversion rate may indicate issues with user experience, pricing, trust, or checkout flow.
Which is a good conversion rate? It depends on many factors. Different sectors have different conversion rates, different products have different conversion rates. It is very important to monitor it over time. To do this, we can use a line chart.
2. Average Order Value (AOV)
Average Order Value indicates how much customers spend on average per order.
Formula:
Total Revenue ÷ Number of Orders
For example, if you have a total revenue of 7500 € and the number of orders is 95 AOV: 7500 ÷ 95 = 78,95 €
Increasing AOV through upselling, cross-selling, or bundled offers is often easier and cheaper than acquiring new customers.
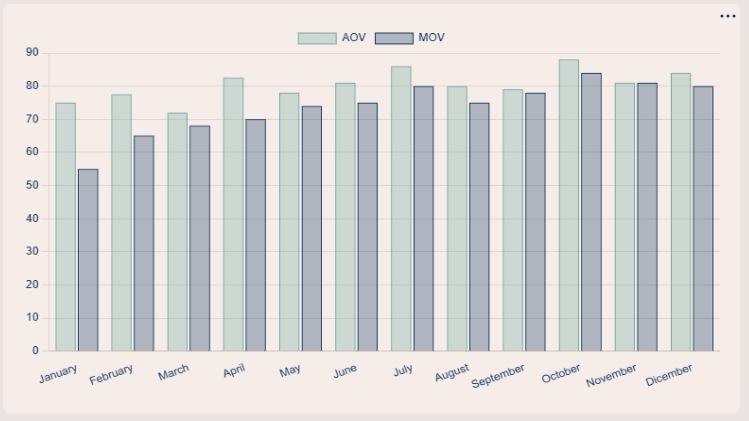
Note: In some cases, it is very important to compare this with Median Order Value (MOV). What is MOV? MOV does not consider the average, but the median, that is the middle value of the orders. How to calculate it? We have to sort the orders by value from highest to lowest and select the middle value.
For example, if we have 95 orders after sorting them, we have to select the value at position 48. Why 48? Because 48 is the middle, 47 orders before and 47 after(47+47+1=95).
Why is it important to calculate MOV and compare with AOV? Because AOV is influenced by extreme values. Taking the example from before, if we have total revenue of 7500 € and 95 orders but only one order has revenue of 2500€ the AOV is a good indicator? The answer is no.
The same happens if 15 out of 95 orders have a value of €10. The average is too conditioned by these values.
So, comparing AOV with MOV over time. It gives us a more reliable indicator.
3. Customer Acquisition Cost (CAC)
CAC aggregates all marketing and sales expenses and divides them by the number of new customers acquired. This metric guides budgeting and helps determine whether marketing channels are scalable.
Formula:
Marketing & Advertising Costs ÷ New Customers Acquired
Keeping CAC under control is essential for long-term profitability, especially when using paid advertising channels.
It is important in this case to calculate in a correct way the Marketing & Advertising Costs which is not always simple.
4. Customer Lifetime Value (CLV)
LTV represents the total expected revenue a customer will generate before cancelling. It incorporates both pricing and churn, making it essential for understanding profitability.
A simplified calculation is:
LTV = Average Revenue Per User (ARPU) / Customer Churn Rate
ARPU can be calculated as follows:
ARPU = Total Yearly Revenue/Total Yearly Active Customers
So, Formula:
LTV = (Total Year Revenue/Total year Active Customer) / Customer Churn Rate
A strong LTV means:
- Expansion MRR is sustainable
- Customers receive ongoing value
- Upsell potential is high
5. Cart Abandonment Rate
This KPI measures how many users add products to the cart but leave before completing the purchase.
Formula:
(Abandoned Carts ÷ Initiated Checkouts) × 100
A high cart abandonment rate may be caused by unexpected shipping costs, complicated checkout processes, or lack of payment options.
6. Revenue Growth Rate
The revenue growth rate tracks how your sales evolve over time.
Formula:
(Current Revenue − Previous Revenue) ÷ Previous Revenue × 100
This KPI helps you understand whether your business is scaling and how effective your strategies are over time.
It is usually compared annually or monthly. NOTE: if you compare monthly or quarterly or similar, be careful and make sure your business does not have seasonal patterns.
7. Return Rate
The return rate measures how often customers return products after purchase.
High return rates can signal problems with product descriptions, sizing, quality, or customer expectations.
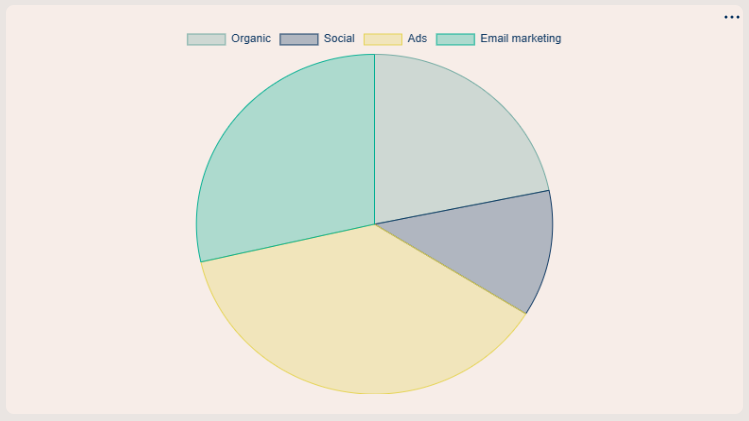
8. Traffic Sources Performance
Understanding where your traffic comes from (organic search, paid ads, social media, email marketing) is crucial.
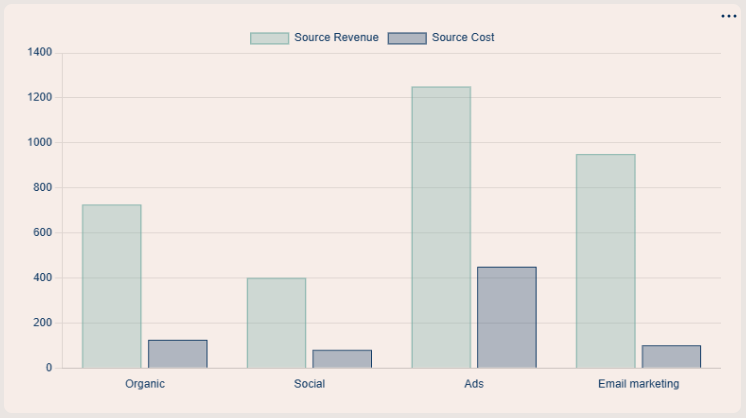
By analyzing the performance of each traffic source, you can focus your budget and efforts on the channels that generate the highest conversions and revenue.
It is important to compare this data with the cost spent on every channel.
Conclusion
Tracking the right KPIs allows e-commerce managers to make data-driven decisions, optimize performance, and grow sustainably. Rather than focusing on vanity metrics, these eight KPIs provide a clear and actionable view of your store’s health.
By monitoring them regularly, you can identify problems early and uncover new opportunities for growth.
Leave a Reply